Course Summaries
After graduation, I joined my family business. I wish to learn about business and grow the current one and create new ones. So this will be my sort of notes and blog. I hope you find value in them.
After graduation, I joined my family business. I wish to learn about business and grow the current one and create new ones. So this will be my sort of notes and blog. I hope you find value in them.
S = 1+2+3+…+(N-2)+(N-1)+N
In reverse order:
S = N+(N-1)+(N-2)+…+3+2+1
On adding:
2S = (1+N)+(2+N-1)+(3+N-2)+…+(N-2+3)+(N-1+2)+(N+1)
=> 2S = (N+1)+(N+1)+… N times
=> S = $\frac{N(N+1)}{2}$
Observation
Range [3, 8] = {3, 4, 5, 6, 7, 8}
=> 6 numbers
Using formula, (8 - 3 + 1) = 6
For N=12: Iterate from $[1, 12]$ and check for factor of 12.
flowchart TD
    1
    2
    3
    4
    5
    6
    7
    8
    9
    10
    11
    12

    style 1 fill:lightgreen
    style 2 fill:lightgreen
    style 3 fill:lightgreen
    style 4 fill:lightgreen
    style 5 fill:pink
    style 6 fill:lightgreen
    style 7 fill:pink
    style 8 fill:pink
    style 9 fill:pink
    style 10 fill:pink
    style 11 fill:pink
    style 12 fill:lightgreen
Total number of factors = {1, 2, 3, 4, 6, 12} = 6
    Execution Time

Time for execution of a code. Depends on external factors.
Let’s assume CPU can perform $10^8$ iterations in 1 second.
=> For $10^{18}$ iterations, it will take $\frac{10^{18}}{10^8}$seconds = $10^{10}$seconds $\approx$ 317 years.
This is an impractical amount of time.
Observation
if i is a factor of N, it means for some j,
$i*j = N$ {both i and j are factors of N}
$=> j = \frac{N}{i}$
| i | j = N/i |
|---|---|
| 1 | 24/1 = 24 |
| 2 | 24/2 = 12 |
| 3 | 24/3 = 8 |
| 4 | 24/4 = 6 |
| 6 | 24/6 = 4 (Reduntant) |
| 8 | 24/8 = 3 (Reduntant) |
| 12 | 24/12 = 2 (Reduntant) |
| 24 | 24/24 = 1 (Reduntant) |
$=> i*i \leq N$
$=> i \leq \sqrt{N}$
Iteration needs to be done for range $[1, \sqrt{N}]$.
Hence, time taken for $N = 10^18$ iterations:
$\frac{\sqrt{10^{18}}}{10^8}$ seconds.
$= 10 $seconds.
Use $i*i \leq N$ rather than $i \leq \sqrt{N}$ because calculating $\sqrt{N}$ gives additional $log(N)$ time complexity. Remember to store i as long to avoid overflow condition.
In order to find if a number is prime or not, use the same function countfractor(N) == 2 as condition, because prime numbers are numbers with just two factors (1 and the number itself).
int i = n;
while(i > 1) {
    i = i / 2;
}
Value of $i$ for N = 100.
flowchart TD
    100 --> 50
    50 --> 25
    25 --> 12
    12 --> 6
    6 --> 3
    3 --> 1

    N --> N/2
    N/2 --> N/4
    N/4 --> N/8
    N/8 --> N/16
    N/16 --> ...
    ... --> ONE[1]
Let number of iterations be $k$.
$N = 2^k$
$=> log_2(N) = k$
for(int i = 1; i<= N; i++) {
    for(int j = 1; j<=N; j++) {
        System.out.println(i+j);
    }
}| i | j [1, N] | No. of Iterations |
|---|---|---|
| 1 | [1, N] | N |
| 2 | [1, N] | N |
| 3 | [1, N] | N |
| … | … | … |
| N | [1, N] | N |
Hence, total number of iterations = $N*N = N^2$
for(int i = 0; i < n; i++) {
    for(int j = 0; j < i; j++) {
        System.out.println(i+j);
    }
}| i | j [0, i] | No. of Iterations |
|---|---|---|
| 0 | [0, 0] | 0 |
| 1 | [0, 1] | 1 |
| 2 | [0, 2] | 2 |
| 3 | [0, 3] | 3 |
| … | … | … |
| (N-1) | [0, (N-1)] | (N-1) |
Total number of iterations = $1+2+3+…+(N-1)$ = $\frac{(N-1)*N}{2}$ = $\frac{N^2}{2} - \frac{N}{2}$
Eg: Big O Complexity of last problem is $O(N^2)$.
Eg: No. of iterations = $N^2 + 10N$
| Input Size | No. of iterations | % of lower order term |
|---|---|---|
| N = $10$ | $10^2 + 10*10 = 200$ | $\frac{10*10}{200}*100$% = $50$% |
| N = $100$ | $100^2 + 10*100 = 11000$ | $\frac{10*100}{11000}*100$% = $9.09$% |
| N = $1000$ | $1000^2 + 10*1000 = 1010000$ | $\frac{10*1000}{1010000}*100$% = $0.99$% |
| N = $10^4$ | $10^8 + 10*10^4$ | $\frac{10*10^4}{10^8 + 10*10^4}*100$ % = $0.099$% |
Therefore, as value of N increases, contribution of lower order terms reduces. For large N, the contribution is almost 0. That’s why the lower order terms and coefficients are ignored when calculating Big O Notations.
| a | b | a & b | a | b | a ^ b |
|---|---|---|---|---|
| 0 | 0 | 0 | 0 | 0 |
| 0 | 1 | 0 | 1 | 1 |
| 1 | 0 | 0 | 1 | 1 |
| 1 | 1 | 0 | 1 | 0 |
| a | ! a |
|---|---|
| 0 | 1 |
| 1 | 0 |
    Marketing

Satisfying consumer needs profitably.
Before starting a business, one must have a Go To Market Strategy. This strategy can be created through the following process:
graph LR
    NEEDGAP(Need Gap Analysis) --> MARKETSCAN(Market Scanning Analysis) --> SEGMENTATION(Segmentation, Targeting, Positioning) --> MARKETMIX(Market Mix 4P/7P)

style NEEDGAP fill:#00ffff
style MARKETSCAN fill:#7fff00
style SEGMENTATION fill:yellow
style MARKETMIX fill:#fec5e5
To form a better picture in mind, I’ll create a mindmap:
mindmap
    Go To Market Strategy
        Need Gap Analysis
            Customer Purchase Cycle
        Market Scanning Analysis
            5Cs
        Segmentation, Targeting, Positioning
            Clustering
            Profiling
            Market Sizing
        Market Mix
            4P/7P of Marketing
In this whole page, we’ll learn this 4 step process to create a Go To Market Strategy.
---
title: Customer Purchase Cycle
---
graph TD
    NEED[Need/Problem] -- Upon Awareness Seeks --> WANT[Want/Solution]
    WANT -- upon willingness to pay creates --> DEMAND[Demand]
    DEMAND -- if can't be replaced becomes --> DESIRE[Desire]
    DESIRE -- if not satisfied creates --> DISSATISFACTION[Dissatisfaction]
    DESIRE -- if satisfied creates --> SATISFACTION[Satisfaction]
    DISSATISFACTION -- creates --> NEED
    SATISFACTION -- leads to --> LOYALTY[Loyalty]
    LOYALTY -- creates --> DESIRE
This whole process of customer up till desire, is governed by the Value. Marketer seeks to increase value either by increasing the benefits or decreasing the costs for the customer.
    Need

Need is a problem or dissatisfaction.
    Want

Want is a solution to a need/problem.
    Demand

Demand is a want along with willingness to pay.

Demand = Want + Willingness to pay
    Desire

Desire is a want that cannot be replaced.

Desire = Want + Can't be replaced
    Satisfaction

Satisfaction is when expectations meet perceived delivery.

Satisfaction = Expectations - Perceived Delivery

When expectations are greater than perceived delivery, it is called Dissatisfaction.
    Loyalty

When customer want to buy a specific product only, not substitutes.
    Behavior Loyalty

Customer buys the known brand. This is generally due to inertia of change, when customer is comfortable buying the known brand and doesn't looks at the substitutes.
    Attitudinal Loyalty

When customer wants to buy a specific product because of the sense of belonging. The customer chooses a specific product at any cost, this generally happens when customer feels the brand has similar basic values as themselves.
    Value

Value is the sum of benefits for the customer minus all the costs he/she has to pay.

Value = ∑Benefits - ∑Costs
By analyzing this framework, we can easily understand the roles of Marketer.
I’ll be updating this blog as I learn new things.
This simple framework can also be used to find out any gaps in markets, if any. The five types of possible gaps are:
A business can be started if there is any one or more of these gaps. A business can’t sustain if it doesn’t fills all the gap.
This is also called Stakeholder Analysis or 5C Analysis. This is basic analysis that any business should do before starting.
Before starting a business, one must check if the business is:
---
title: Stakeholder Analysis / Market Scanning Analysis
---
mindmap
    5C((5C))
        COMPETITION(Competition)
            PORTERS5FORCES(Porter's 5 Forces)
            HHI(Herfindahl-Hirschman Index)
        CONTEXT(Context/PESTLE Analysis)
            Political
            Economic
            Sociocultural
            Technological
            Legal
            Environmental
        CUSTOMER(Customer/Consumer)
            AIDA(AIDA Framework)
            CDM(Customer Decision Model)
        COMPANY(Company)
            SWOT(SWOT Analysis)
COLLABORATOR(Collaborator)One Model of analyzing competition/profitability is called Porter’s 5 Forces. The five forces are:
---
title: Porter's 5 Forces
---
mindmap
    RIVALRY(Extent of Rivalry)
        SUPPLIER(Bargain of Suppliers)
        SUBSTITUTION(Thread of Substitution)
        ENTRANCE(Threat of New Entrance)
CUSTOMER(Bargain of Buyers)If there are multiple brands with similar value propositions, and very few buyers, ie. supply is greater than demand, the buyers have better power to bargain and ask for better prices. They ask brands to lower prices or they may buy from other brands.
Extreme case is when there is only one buyer and multiple suppliers, this market is called Monopsony. One example is market of satellites and missiles. The Government is the only buyer, but there are multiple suppliers.
If the raw material a brand uses has very few suppliers, suppliers can have greater bargain power to increase their costs. They may ask higher prices for the raw materials or they may sell it to other company.
Extreme case is when there is only one supplier and multiple buyer, this market is called Monopoly. One example is radio frequency bands which can only be bought from governments.
If a new product is launched in the market with better value proposition, the brand may have to reduce their prices to increase their value of product and match it with the new product. (Value = ΣBenefits - ΣCosts)
If new product enters the market, it will start replacing the existing products. To increase the customers, the other brands will try to increase their products value by decreasing prices (assuming it cannot add other benefits). This will make the market less profitable.
Rivalry of market depends of two factors, the number of products and the distribution of market shares. If there are more number of products, it means the market is more competitive. If the market share is evenly distributes amongst all products, means the market is more competitive.
HHI is used to measure the extent of rivalry in a market.
In simple words, HHI is the sum of square of market share of all the products in the market.
The formula of HHI: $$ HHI = \sum_{i}(MS_{i})^{2} $$ $MS$ is Market share of a product.
$ 0 \leq HHI \leq 1 \ $ if Market Share is in fraction.
$ 0 \leq HHI \leq 10000 \ $ if Market Share is in percentage.
As a general rule of thumb in industry, HHI > 0.3 is called a less competitive market and hence more profitable, whereas a market with HHI < 0.3 is said to be more competitive and less profitable.
After understanding how to analyze Competition and Profitability, we’ll learn how to understand customer/consumer.
Customers are the people who buy the product whereas Consumers are the people who finally use the product. Example: for baby diapers, baby’s parents is the customer (make purchase decision) and the baby is the consumer (actually uses it). Many times customer and consumers are same.
AIDA Framework is used to understand how consumers make decisions. It stands for: A -> Awareness about the need/problem I -> Interest to look for options/alternatives D -> Desire to choose/consider A -> Action to buy/not buy
graph TD
    NEED(Need) --> EVOKED
    AWARENESS(Awareness Set) --> EVOKED(Evoked Set)
    FRIENDS(Friends/Family) --> CONSIDERATION
    AVAILABILITY(Lack of Availability) --> CONSIDERATION
    EVOKED----> CONSIDERATION(Consideration Set)
    MARKETING(Marketer's Market Mix) --> CONSIDERATION
    CONDITIONS(External Conditions) --> CONSIDERATION
    CONSIDERATION--Comparing Values--> SELECTION(Selection Set)
    SELECTION --> PURCHASE(Choice/Purchase Set)
Here are some definitions related to consumer awareness:
    Awareness Set

Products/brands a consumer is aware about. Any product/brand a consumer has ever heard about will be considered in the Awareness set.
    Evoked Set

Top-of-the mind brands/products. The brands/products with quick recall for a customer are called Evoked Set for him/her.
    Consideration Set

Products that a customer considers to buy are called consideration set. The consideration set is often influenced by Friends and Families.
    Selection Set

After analyzing Consideration set, the customer narrows it down to Selection Set, which is a handful of products he can buy depending upon the prices and his/her specific needs.
    Choice Set

Final products that the customer chooses is called Choice Set/Purchase Set.
In Low Involvement Process, the customer moves from Awareness Set to Selection Set and to Purchase Set. In other words, customer picks up any know product that solves his/her problem without doing much analysis. In High Involvement Situations, the customer passes through all the steps.
Later AIDA model was replaced by Consumer Decision Model. CDM takes into account one more step other than AIDA model. Consumer Decision Model considers these five aspects of customer decision:
---
title: Consumer choice process as per CDM
---
graph TD
    NEED(Need) -- On Motivation --> KNOW(Know/Learn) -- On Learning --> UNDERSTAND(Understand) -- As per Attitude, may --> LIKE(Like/Dislike) -- then may --> INTENT(Buy/Not Buy)
The whole consumer choice process is governed by two factors: Culture and Personality.
Attitudes are formed opinions. Attitude has a direction (negative or positive) and magnitude (intensity). In simple words it is what we like or not like.
Attitude starts with Consumption (a person would like to consume a product or not), then it may carry forward towards Product/Product Category (a person likes the product or not), then it carries forward to brand (the customer likes the brand or not).
---
title: Consumer Attitude formation steps
---
graph TD
    CONSUMPTION(Attitude towards Consumption of product/service) -->  PRODUCT(Attitude towards Product/Service) --> BRAND(Attitude towards Brand offering the product/Service)
Increasing attitude toward consumption is called Market Creation Process. Eg: Ola, Uber created attitude towards convenient taxi.
There are three reasons we form attitude:
You can never be a good marketer with a bad product.
If you know the product is best, make sure the customer goes through all the decision making process.
Context looks at the Macro Environmental Factors which affects the business. This is also called PESTLE Analysis:
An example of a business satisfying both other Cs but cannot succeed because of the context is BigMac. BigMac is a beef burger very successful in western countries. But it is not a success in India because of the sociocultural factors. In India, most population treats cows as holy animal and would not eat beef burger. the business is Profitable (no competition) and Understandable (customers have loved the taste worldwide).
An example of Technological context is the advent of AI.
Before going into market, the company must know its strengths and the opportunities those strengths will give it, and also the weaknesses and the possible threats those weaknesses can pose to the business. This analysis is called SWOT Analysis (Strengths, Weakness, Opportunities and Threats). SWOT Analysis is by mapping companies strengths to the opportunities those strengths can open up, and mapping weaknesses to the threats those weaknesses can pose to the business.

SWOT Analysis
    Segmentation

Segmentation is the process of dividing customers from heterogenous groups (with different needs) to homogenous groups (similar needs).
graph TD
    PSYCHOLOGICAL(Psychological Variables) --> CLUSTERING(Clustering)
    BEHAVIORAL(Behavioral Variables) --> CLUSTERING
    DEMOGRAPHIC(Demographic Variables) --> PROFILING(Profiling)
    CLUSTERING --> SEGMENTATION(Segmentation)
    PROFILING --> SEGMENTATION
    SALES(Sales Potential) --> TARGETING(Targeting)
    SEGMENTATION --> TARGETING
    PROFIT(Profit Potential) --> TARGETING
    UNIQUE(Unique Needs) --> TARGETING
    Profiling

Describing and naming clustered groups.
An inefficient way to segment customers is through demographic variables (age, geography, location, income, religion). This is commonly used because this data is easier to get and more objective. But the accuracy of the formed segments through this process is often low because people with similar demographics may not have similar needs/problems.
The better way to segment customers is through behavioral and psychological variables. People with similar behavioral patterns and interests are more likely facing similar problems.
    Psychological Variables

Personality + Values + Lifestyle/Behaviors
Personalities can be of 3 types:
mindmap
Personality
Compliant
Desire to belong
Following rules
Need for love and belonging
Detached
Break the rules
Need for self-actualization
Do things because they like to do it
Aggressive
Need for achievement
Success and esteem
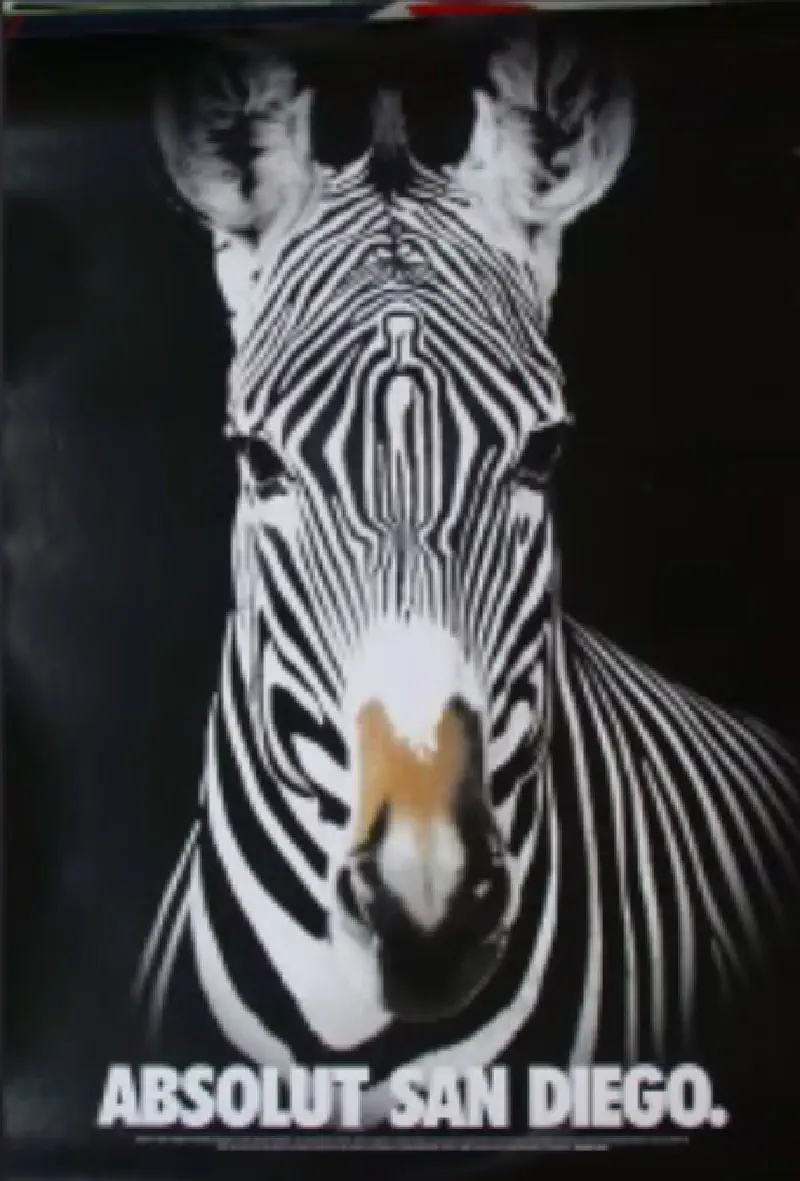
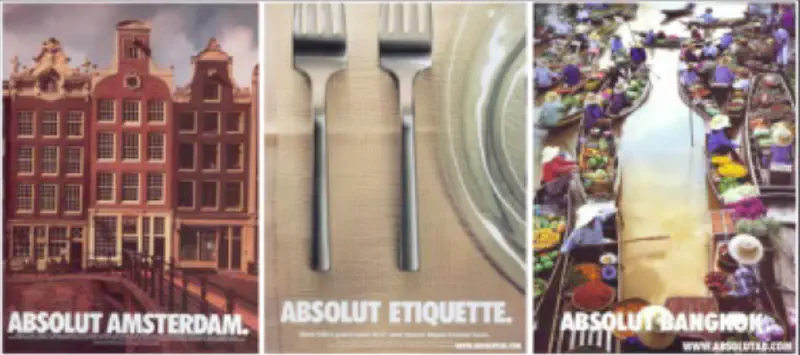
Need for powerHere is an example of commercial targeting Aggressive Personality Type.
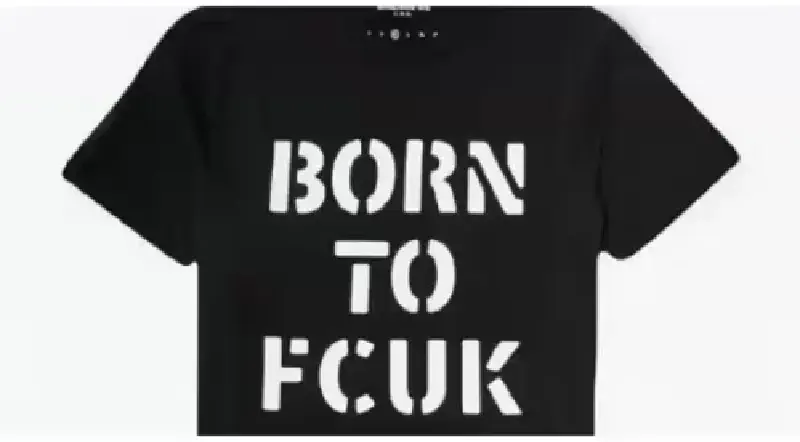
Here is an example of commercial targeting Complaint Personality type.
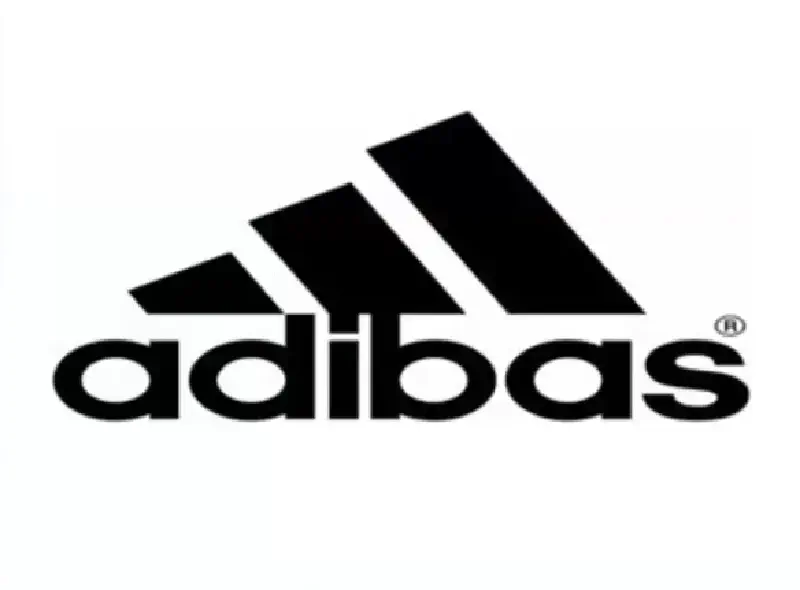
Here is an example of commercial targeting Detached Personality type.
Values are formed through upbringing. Values are the beliefs that people have about the world. A few examples of values are:
Behaviors are the habits that people have. There are more than 1000 documented behaviors. Hence there are many behavioral variables.
Usually for segmentation, a questionnaire (with multiple choice questions, with choices being levels) is circulated in the market with questions related to customer behavior and psychological variables. The responses are then clustered based on the similarity of the responses.
Each question will be considered as a variable and levels plotted on a graph. Each point represents a customer. The similarity between the responses is calculated by the distance between the points on the graph.
The distance between two points on the graph is calculated as the sum of the squared distances between the points.
The clustering is usually performed by a software. We specify the number of clusters we need, and the software computes the clusters.

Clustering Graph
After the software has formed the clusters, we’ll use the clusters demographic data to label the clusters, so that it is easier to convey the information to people from other departments, like sales department. The process of labeling and naming the clusters is called profiling. Different profiles may have some demographics overlap.
The AIO (Activity, Interests, Opinions) Model is a helpful tool to analyze customer behavior.
On the basis of segments, customer persona is formed.
Systematic Segmentation is performed in three steps:
graph LR
    QUALITATIVE(Qualitative Research) --> SURVEY(Survey Design)
    SURVEY --> CLUSTER(Cluster Analysis)
Targeting is the process of selecting the best group/s among the formed segments. Targeting is done on the basis of these three factors:
Sales potential is generally estimates through Market Sizing process. Market Sizing is done by estimating TAM, SAM and SOM.
    TAM (Total Addressable Market)

Total Addressable Market is the total number of population that would be willing to buy the similar product/service globally.
    SAM (Serviceable Available Market)

Serviceable Available Market is the subset of TAM which the company can reach to. This can be restricted by geography and resources.
    SOM (Serviceable Obtainable Market)

Serviceable Obtainable Market is the subset of SAM which company can acquire in a given amount of time. This is restricted by the competition and the percentage of market share the company can acquire.
Example, if one wishes to setup a lemonade shop at locality,

TAM, SAM, SOM
The market sizing estimation can be performed in two ways:
As already discussed, profit potential is estimates by analyzing competition and HHI. Unique needs need to be identified by segments of segmentation.
After identifying target group/s, the company needs to position itself in the market.
graph TD
    POSITIONING(Positioning) --> POP(Point of Parity)
    POSITIONING --> POD(Point of Difference)
    POP --> CATEGORY(Category POP)
    POP --> COMPETITIVE(Competitive POP)
    Positioning

Positioning is the process of occupying maximum mind-space of customers.
Point of Parity
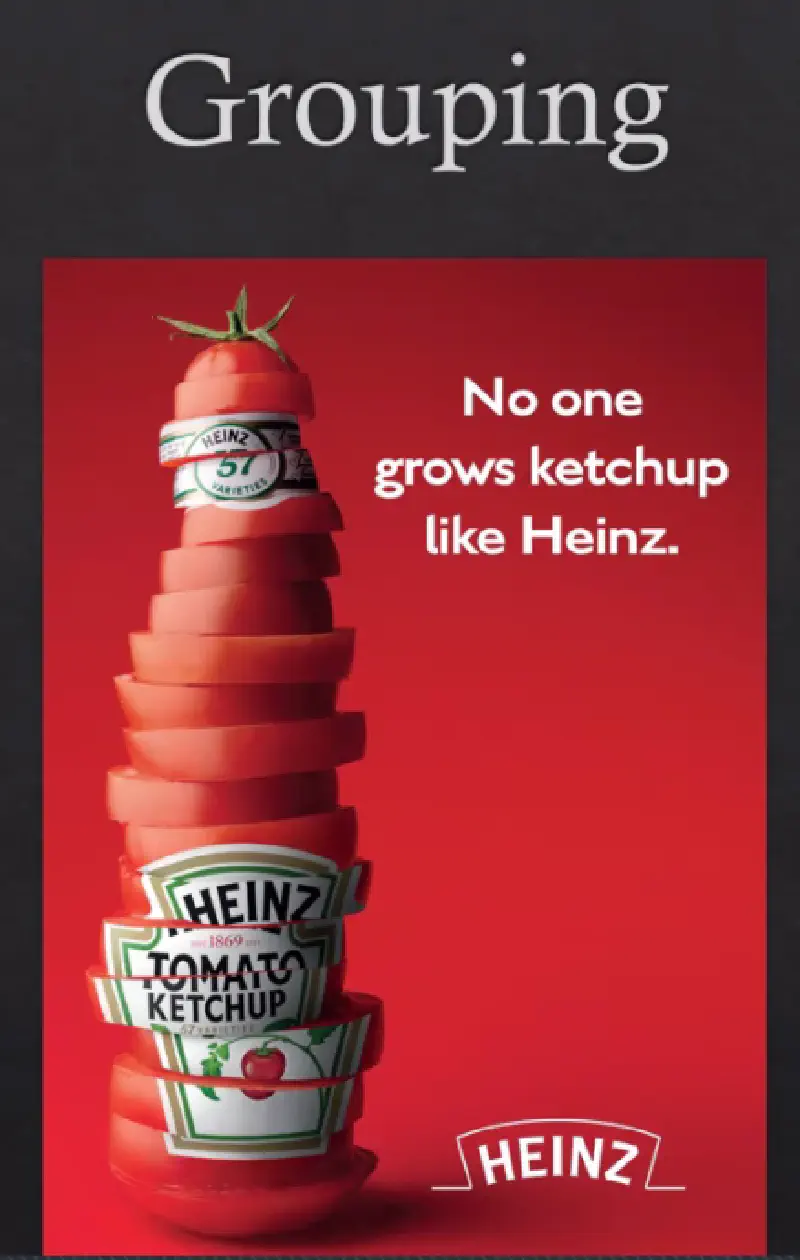
Point of parity is the characteristics which are similar to competitors so that customers can trust the new product. Eg. for a new ketchup to gain customer trust, it must look like ketchup (red color, bottled etc).
    Point of Difference

Point of Difference is the differentiators that the new product/service has which can be advertised to customers. Eg. Maggi tomato ketchup campaign emphasized the sweet and spicy taste as differentiator from other ketchups.
    Category POP

Category Point of Parity is characteristics similar to all other products in the same category, which allow the new product/service to gain trust. Eg. for a new ketchup, the product must be similar to other ketchups.
    Competitive POP

Competitive Point of Parity is characteristics similar to leading competitors, which allow the new product/service to gain trust. Eg. new mobile phones can advertise themselves having similar processors than top phones.
A good book on positioning is “Positioning - The Battle for Your Mind, by Al Ries and Jack Trout”.
A solution consists of four components:
The 4Ps model was introduced by Jerome McCarthy in 1960.
    Product

Product is a bundle of features that provide benefits.
    Goods

Product + Service

    Core Benefit

Bare minimum features that are required to solve the need.
    Expected Product

Bare minimum features that consumers seek in order to accept the product as a solution.
    Augmented Product

Additional features that separate a product from it's competitors.
    Potential Product

The unknown features that can be added to the product to improve it in future.
Let’s take example of a hotel industry. If you are in a jungle with no options to sleep, any closed room-like thing would solve your need to sleep. You would sleep in any cave or barren room on the floor. So, just a room where you can be safe from predators and others for some time is a basic product for the problem. This is called Core Benefit.
If you are in city, you’ll compare other hotels and expect a good bed, clean bedsheets and clean bathrooms as the bare minimum features to stay in the hotel. This is called Expected Product. This can also be called Point of Parity.
If among all hotels, only one hotel provides you a television also, that will be called Augmented Product. This can also be called Point of Difference. Process of adding additional features in order to stand-out is called Augmentation.
Whenever there is augmentation in any market, competition mimics the augmentation and and tries to convert augmented product as the expected product.
Another example of soap industry: In 1990s, soap was sold by cutting small pieces from a large bar and sold by weights. Then some soaps augmented the product by selling them in standard packaged bars, gradually the augmented soap became the expected soap.
Branding is one augmentation that competition cannot mimic.
    Market Maturity

A theoretical condition where no more augmentations are possible in a product. In practice, every product can be augmented.
Potential Product is an abstract idea which describes the future upgrades in the product.
Goods can be of three types:
Services are high on these four parameters:
Services are high on intangibility (cannot be measured). So to stand-out, companies use Physical Evidences so that consumers can compare the services. Example: knowledge gained from a course cannot be directly measured to institutions show placement statistics and exam score.
Products are high on tangibility, but to differentiate the product from competitors, intangible elements are added (eg. brand equity).
    Brand

A promise or trust that a particular product makes.
Since services are provided by people, they are subject to variability. Example a class given by a teacher A would be different from teacher B. Even the classes given by teacher A would be different at different times.
To minimize variability, companies put up processes.
    Process

Standard operating procedure.
Services are simultaneously produced and consumed at the same time. Eg. a barber can only cut hair when the consumer is sitting on the barber chair.
Also, services may be provided to multiple consumers simultaneously. The service provider must be trained enough to satisfy multiple consumers simultaneously.
Products can be stored and used for future needs. Services cannot be stored and used for future needs.
Eg. a flight ticket cannot be stored and used for future needs, once the flight takes off, empty seats are wasted. To control these wastage, flight companies use dynamic price strategy. They keep prices very low for people booking several months before the flight. This ensures some seats are filled. Then they increase the price as the flight date comes closer, but if the seats aren’t being filled, they again reduce the prices. Also, just one day before the price, they increase the prices a lot because people generally book the flights one-day before in case of emergencies.
Similarly, tourism industry also varies prices of hotels based on the season. Food is perishable, hence when it becomes at the verge of perishing, the prices are lowered.
    Product Planning

Ensure sustainability of the organization/company.
To launch new products, companies have to plan the product.
graph TD
    PRODUCTSERVICE(Product/Service) --> PLAN(Plan)
    PLAN --> BRAND(Brand)
    BRAND --> PROMOTION(Promotion)
    BRAND --> PLACE(Place/Distribution)
    BRAND --> PRICE(Pricing)
    Market Penetration Strategy

Increasing the consumption of existing products to existing consumers.
    Market Development Strategy

Taking the existing products to new markets. It can be either to different geography or to different segment (customers with different needs).
    Product Development Strategy

Creating new products for existing customers (segments).
    Diversification

Creating new products for new segments. It can be either related (similar manufacturing process) or unrelated (different manufacturing).
We’ll take example of coca-cola. If it wants to penetrate market, it can create new packages like Pet Bottles, or Christmas Special or some limited edition bottles. If it wants to develop new markets, it can try to expand same coca-cola to Arab countries. If it wants to create new products, it can create diet coke. If it wants to diversify, it can create new products like T-Shirts (Unrelated) or Vitamin Water (Related).
Apart from Ansoff Matrix, product planning can also be understood through extensions:
One more model to plan products is BCG Matrix. It is a useless model which classifies the products based on their Market Growth and Relative Market Share, both of which are not possible to measure objectively. Weird names are provided to the four types of products: Stars, Question Mark, Cash Cows and Dogs.

The fundamental assumption that the growth rate of an industry and relative market share of a product can be measured objectively is incorrect. Therefore personal biases come into play when classifying the products, hence this product is useless. I added this just because it was taught in class.
Another useless model which classifies the product based on some imaginary stages: Introduction, Growth, Maturity and Decline. It plots graph between time and sales.

The only problem with this model is that it is too generalized and oversimplified. Many products don’t live long enough to see the growth stage and you cannot predict the decline of any product as long as it is in the market. Innovations and situations can change destiny of any product.
    Distribution

Process by which products are transferred from Manufacturer to consumer, and feedback and money are transferred from customer to manufacturer.
graph TD
    MANUFACTURER(Manufacturer) --> CFA(Carry and Forwarding Agent/Super Stockist)
    CFA --> WHOLESALER(Wholesaler/Super Distributer)
    WHOLESALER --> DISTRIBUTOR(Distributor)
    DISTRIBUTOR --> RETAILER(Retailer)
    RETAILER --> CUSTOMER(Customer)
Earlier, when manufacturers were limited, they were the most powerful in this distribution process. Now, with increase in competition, retailers have become the most powerful since they have the information of the customers.
Carry and Forwarding Agent is a company which is responsible for carrying the product from manufacturer to wholesaler. This is owned by company but located in different states. This was a technique to reduce tax because VAT was different in different states. After introduction of GST, the CFA is no longer needed.
    Intermediation

Introducing a new entity in supply chain.
    Disintermediation

Removing the intermediary entity from supply chain.
    Reintermediation

Changing the intermediary entity from supply chain.
---
title = "Disintermediation/D2C"
---
graph TD
    MANUFACTURER(Manufacturer) --> CFA(Carry and Forwarding Agent/Super Stockist)
    CFA --1% commission--> WHOLESALER(Wholesaler/Super Distributer)
    WHOLESALER --3% commission--> DISTRIBUTOR(Distributor)
    DISTRIBUTOR --5% commission--> RETAILER(Retailer)
    RETAILER --30% commission--> CUSTOMER(Customer)
    MANUFACTURER --Disintermediation 30% commission--> CUSTOMER
Direct to customer (D2C) is a method developed after the popularity of online markets. The manufacturers can now take direct orders from end customers without a need to have a local retail shop. The distribution happens in almost same way as before. Therefore, D2C is more of a branding game rather than a distribution game.
Most of new online businesses are just make use of intermediation processes. Eg. Swiggy is an intermediatory between food producers and food consumers, uber added as an intermediatory entity between cab drivers and customers. MakeMyTrip is a new intermediatory entity between travelers and hotels. Amazon is a distribution based business.

Intermediation by Uber

Optimal Distribution Strategy
    High Information Product

Products for which information is also needs to be provided along with the product. Any new technology can be regarded as an High Information Product. This depends more on how customer perceives the product.
    High Customization Product

Products which are highly customized for individual customer is called high customization product. Eg. Dominos, Starbucks.
Concentrated and fragmented market is considered on geographic basis and the number of customers in total.
If the product is highly customized or highly informational, and very few customers are there to deliver to, then it is recommended that company should directly fulfil needs of the customers. Eg. aircraft
If the product is highly customized or highly informational, but the customers are scattered all across geography, then it is recommended that company should franchise the product to the customers. Eg. Kaventers, Tata Motors. This makes it easier to train franchisees so the customers can get customized products and proper training for their products.
If the product is low in customizations and less information is needed for customer to use it, and customers are located in smaller geography or customers are less in number, it is recommended that company should make deals directly with the customers and a third party should fulfill the needs of the customers.
If the product is low on customization and less information is needed, and customers are scattered in the geography, then it is recommended to be distributed via classical third party distribution. Eg. soap, pen etc.
The distribution systems often change over time. Eg. MacBooks were earlier sold only via franchise, but now they are available at 3rd party distribution platforms like amazon.
graph TD
    MANUFACTURER(Manufacturer) --channel 1--> CUSTOMER(Customer)
    MANUFACTURER --channel 2--> RETAILER1(Retailer)
    RETAILER1 --channel 2--> CUSTOMER
    MANUFACTURER --channel 3--> DISTRIBUTOR(Distributor)
    DISTRIBUTOR --channel 3--> RETAILER2(Retailer)
    RETAILER2 --channel 3--> CUSTOMER
Same product can reach the customer via different channels and the price for customers will be different. This is called Intra-Brand Competition or Intra-Channel Competition or Channel Conflict. This may lead to reduction in price of the product.
    Webrooming

Checking product and price online, and buying offline.
    Showrooming

Checking product and price offline, and buying online.
There are two methods to avoid it:
Make certain SKUs exclusive for a certain channel. Eg. Samsung may restrict newer models exclusive for its own outlets and older models can be sold via the classic 3rd party distribution.
This is a philosophy that emphasizes seamless experience on all the touchpoints. That means, customer may be able to check the product in any channel and buy it in any channel. This is practically difficult because then the incentive systems needs to change. Currently, sales incentives are based upon sales made through specific channel, but this system would not be fair in an omni-channel experience.
    Touchpoint

Any interaction of customer with product/brand is called a touchpoint.
To deal with inter-brand competition between two supermarkets, brands use the following two techniques:
Anchor Store: Malls often have a popular store which attracts customers into the Malls. This is called anchor store strategy.
A good paper to have better reference is Integrated Marketing Communications paper.
The framework is quite exhaustive. It consists of following steps:
If these questions are answered accurately and in sequence, probability of running a successful campaign is very high.
Promotion can serve two purposes: Create Awareness and Induce Purchase (Sale).
graph TD
    PROMOTION(Promotion) --> AWARENESS(Create Awareness)
    PROMOTION --> PURCHASE(Purchase Inducement)
    AWARENESS --toward--> NEED(Consumption/Need)
    AWARENESS --toward--> PRODUCT(Product/Product Category)
    AWARENESS --toward--> BRAND(Brand)
    PURCHASE --> SALES(Sales Promotion)
    PURCHASE --> CONSUMER(Consumer Promotion)
    SALES --> MARGINS(Margins for retailers)
    SALES --> AWARDS(Awards for retailers)
    CONSUMER --> BOGO(Buy One Get One offers)
    CONSUMER --> PREMIUMS(Premiums)
    CONSUMER --> BUNDLING(Bundling)
    CONSUMER --> TRIAL(Trial)
CONSUMER --> SAMPLING(Sampling)There are many types of advertisements, some common types of advertisements are:
These advertisement types are not exclusive, these are just ideas to provide direction of thinking.
Apart from advertising, there are other methods to promote awareness like:
Sales Promotion: For sales promotion, one must incentivize the customer, i.e. retailer. This is generally done through increasing margins (external) or giving schemes/tours/offers (internal) to the retailer.
Consumer Promotion: This process involves providing incentives to end consumers, like:
| Publicity | Public Relations |
|---|---|
| Organically Generated | Company Induced |
| Can be both +ve or -ve | Always positive |
Publicity may be seeded by company through Seeding Strategy.
Pricing is the most unique P among all the 7Ps because it is the only P that brings money in the company, all other Ps take money out of the company.
mindmap
Price
    Altering Prices
        Cost Plus
        Target
        Perceived Value
        Value
        Two Part
        Decoy
        Psychological
    New Price
        Skimming
        Penetration
Going RateThe easiest and most straightforward way to price things, but one of the most ineffective way of pricing. The simple formula used for this is: $$ Price = \dfrac{FixedCost}{N} + VariableCost + Margin $$ Where $FixedCost$ is the initial setup cost, $N$ is the total number of product sold in lifetime, $VariableCost$ is the additional cost per unit, and $Margin$ is the additional margin the company wants to gain.
Example, if cost of setting up a pen factory is ₹50000 and it is estimated that it can product 10000 pens in lifetime, additional material cost for each pen is ₹4, and the manufacturer wants ₹2 profit on each pen, then according to equation, the price will be ₹ $50000/10000 + 4 + 2$ => $₹11$.
The problem with this method is that it is based on guess work, i.e. we don’t know what $N$ will be. If we over-estimate the $N$, it is easy to take up losses. Also, this method may give very low prices, which may incur Notional Loss to the company.
    Notional Loss

When a company has potential to make more profits but is doesn't do so, it is called notional loss.
This method was developed by japanese. It is also called Conjoint Analysis or Part-Worth Analysis. It is based on asking customers questions and willingness to pay. It is a complex mathematical process. Through the analysis, a price is estimated. After that, feasibility of the business is estimated using the Cost Plus Pricing formula. The $N$ is estimated using market sizing (how many customers will purchase the product). Then for business to be feasible, margins must be positive. This condition is checked before starting any business.
So far, it is not actually a strategy, but philosophy. More intellect has to go into it to convert it into a mathematical/logical strategy. It says one should focus on the customer’s need and perceived value of the solution/product.
Eg. if there are two wood cutting tools, A Cutting Tool and B Cutting Tool. A requires to be replaced after 30hrs and costs $1, whereas B requires to be replaced after 120hrs and costs $5. If B is not getting sales, the most obvious solution for B will be to reduce price. But it should actually change the perception of the customers around its product. It takes 20 minutes to change the tool for the labour. To work for 120hrs, the tool A requires 1hr extra just to change tool. Average cost of labour in US in $15 per hour. Hence the actual cost is 4 + 15 = $19. Hence even if the cutting tool raises it’s price to $16, it still is providing greater value that A.

Another example is a person in US buying a fridge. Comparing two brands MayTag and LG. MayTag costs $2000 and lasts for 25 years whereas LG costs for $800 and lasts for 10 years. If someone came to US just to do service for 5 years, he/she may prefer LG, but if someone has settled in US, he/she may prefer MayTag. One may also consider the resale value of the fridge after 5 years.
To increase the value, companies reduce the price. Value = ∑Benefits - ∑Costs
Most common example is of EDLP (Every Day Low Price).
Minor tweaks in prices that have major perception difference. Eg. pricing things at 99 appear much cheaper than priced at 100. Dove also used this to appear premium by pricing it’s sachet at Rs. 7. Pricing things at 45 and 55 also work in similar way. This technique is called last digit manipulation.
Subtraction principle means showing high price and slashing it off and display selling price as very low. This is also a psychological tactic to change perception that the product is very cheap.
Introducing intermediate option to subtly push customers into buying the expensive option.
Eg. The Economist Magazine had introduced three prices: $59 for digital version, $126 for only print version and $126 for both digital and print version. The only print version was a decoy to convince people that the both print and digital version is more valuable.
Eg. popcorns in theatres often have three versions, small $3.5, medium $6.5 and large $7.0. Because of introduction of the medium variation just slightly less price than large, the large variation appears to provide more valuable, hence customers tend to purchase more of the large variation.
When a product requires two parts to be used, one fixed part and other variable part, generally price of fixed part is kept low and the variable part is more expensive. Few examples are razor and blade, printer and toner.
When introducing a high information, the product is often introduced at high price, then prices are reduced over time. This allows the company to cater to the customers with high willingness to pay and also low willingness to pay.
The new product is introduced at very low price to gain market share. Then gradually, company may increase prices. This strategy is used in price sensitive market. Eg. Uber
Price of new product is set similar to existing similar products. This is also called clueless pricing. This is generally used on price insensitive markets.
When same product is sold at different prices to different customers. Three types of price discriminations are:
Bundling is a revenue maximization technique.
Eg. if 100 people are willing to pay Rs. 100 for an SRK movie and Rs. 50 for Amir Khan movie. Another 100 people are willing to pay Rs. 50 for SRK movie and Rs. 100 for Amir Khan movie.
Then of company shows both films separately at Rs. 100, they’ll earn 100*100 from first 100 people and 100*100 from second 100 people. In total, the total revenue would be 20,000.
Instead, if the company bundles both films together at Rs. 150, then all the 200 people will be willing to pay the amount and they’ll earn 200*150 = 30,000.
These are a must-read for anyone interested in a career in Consulting and Marketing.
There are two articles on Segmentation.
For positioning and targeting please read the sections in Corey and Dolan papers. You can also refer to the " Positioning: The Battle for Your Mind" by Al Ries and Jack Trout for further reading. (https://www.amazon.in/Positioning-Battle-Your-Jack-Trout/dp/0071373586)
I have also attached 5 papers on Product and Service Management. These articles will give you a basic understanding for a Product Management role.
Also find attached the articles on Branding, Distribution, Pricing and Promotion. These articles cover the non-product part of the marketing mix.
Articles on Branding
Articles on Sales and Distribution
Articles on Pricing
Article on Promotion
Reading Material
In the Segmentation and Targeting process, we need to understand the customer’s behaviors. We will do it by collecting data about the psychographic Behavioral and Psychographic variables.
Preference = Behavioral + Psychographic Variables
Everyone wants to stay in a state of homeostasis (Ideal State), but oftentimes, we are not in the ideal state. The difference is called the Need Gap. Need Gap leads to motivation to seek solutions.
    Divestment

Consumptions that can be consumed once a lifetime. Eg: funeral services, appendicitis surgery.
graph TD
    NEED(Need) --Drive/Motivation-->AWARENESS(Awareness Set formed by Learning)
    AWARENESS --Memory--> EVOKED(Evoked Set)
    EVOKED --Evaluate/Understand--> CONSIDER(Consideration Set formed by Perception)
    CONSIDER --Like/Attitude--> SELECTION(Selection Set)
    SELECTION --> INTENT(Intent)
    INTENT --> BEHAVIOR(Behavior)
This whole process depends upon:
Everyone wants to stay in a state of comfort (ideal state). The gap between the ideal state and the current state is called the need gap. The need gap gives rise to motivation.

Need-Gap v/s Motivation Graph
Motivation is derived from motive which means to move. Motivation can be considered as a force.
Motivation depends on two things:
Eg. if someone has mild dandruff, he/she may not be even looking for solutions. But if the dandruff is high, then the person would be motivated to look for a solution. On the other hand, if there is any shampoo that makes hair more stylish and smooth, then the solution itself is attractive, hence people are motivated to purchase it.
Customers compare solutions first through cost-benefit analysis, i.e. comparing value. If two solutions provide the same value, then the comparison is made using something called Valence.
graph TD
    Motivation --Depends on--> Problem(Problem or Need-Gap)
    Motivation --Depends on--> Solution(Solution or Outcome Attractiveness)
    Solution --Compared via--> Value(Value)
    Solution --If value same, compared via--> Valence
    Valence --Can be--> Approach(Approach Valence, this is preferred)
    Valence --Can be--> Avoidance(Avoidance Valence)
    Valence

Direction of drive/motivation.
Valence can be towards:
Examples:
Krack Heel Repair New Ad 2014 Salesmen OFFICAL HD: This is an example of an avoidance valence advertisement.
Itch Guard: This is an example of avoidance valence advertisement.
Colgate Total Pro Gum Health Ad English: This is an example of avoidance valence advertisement.
Close Up TV Commercial (2) - Paas Aao Na - Lintas, BLUE i & MOKKSHA: This is an example of approach valence advertisement.
Pension Plans - HDFC Standard Life Insurance - Sar Utha Ke Jiyo: The example has both aspects, starting with avoidance then ending with approach valence.
Apne Parivar Ko Apne Dum Pe Jeena Sikhao: The example is of approach valence.
If the values are equal, then engagement is more with approach valence advertisements. Marketers should try to create advertisements that are more approach valence.
    Grudge Purchase

Purchases that happen unwillingly out of necessity. Examples are condoms and insurance.
Process of quantifying valence is called Laddering or Hierarchal Value Map or Terminal Value Map. We’ll learn this in Market Research module. Theoretically, this is done through FAB Analysis. Feature, Advantages and Benefits.
graph TD
    Feature --> Advantages(Advantages/Attributes)
    Advantages --> Benefits
Example if you want to purchase a laptop, features will be RAM, processor etc. Advantages will be fast computing. Benefits will be play games without lag. Customers talk at the feature level, but think at the benefits level. Marketer must understand the benefits that customers need.
In laddering process, we need to ask Why question in each step and figure out the terminal benefit the customer is seeking. Example of a cream, the customer may ask for a moisturizing cream because she wants a healthy skin. She wants a healthy skin to look good. She wants to look good because she wants to feel confidence. Because of this, fair and lovely always emphasizes on confidence rather than moisturization or any other feature.
graph TD
    Moisturizing --> Healthy(Healthy Skin)
    Healthy --> Look(Look Good)
Look --> Confidencemindmap
Learning/Conditioning
Classical Conditioning
Instrumental Conditioning
Positive Reinforcement
Negative Reinforcement
Vicarious ConditioningLearning is also called conditioning. There are three types of conditioning:
Experiments were conducted by Ivan Pavlov.
He generalized the theory that when an Neutral Stimulus (bell) is combined with an Unconditional Stimulus(food) for some time, the Unconditional Response (salivation) is triggered also with Neutral Stimulus. Eg. Hungry Kya => Snickers, Thanda Matlab => Coca Cola.
Best Ad by Aamir Khan… For Coke.. As Punjabi Jatt: This is an example of classical conditioning.
Titan Watches: Advertisement (Wedding): In the advertisement, conditioning is done through Beethoven Symphony.
TITAN -The Joy of Gifting: In the advertisement, conditioning is done through Beethoven Symphony.
All the brand elements can be used for classical conditioning like taglines, logo, jingles etc.
This is also called Operand Learning Technique. B. F. Skinner did experiments with rats. There are two ways to condition, positive reinforcement and negative reinforcement.
Example is cashbacks, BOGO offers, test drives.
KFC Classics: Buy One Get One Free: This was an example of positive reinforcement.
NIVEA SUN introduces Mr Sun – “There’s only one sun”: These were examples of negative reinforcement.
Also called slice of life advertisement. Vicarious learning is often done through brand ambassadors. This is also called observational learning.
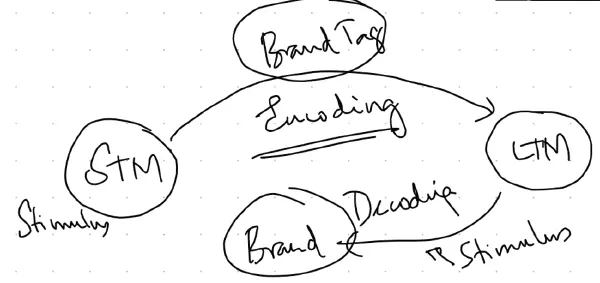
Memory is of two types:
Long term memory has associations to certain stimulus which allows them to be recalled easily. The process of converting a short term memory to long term memory is called encoding. It if often done using brand elements like brand tags, jingles, logos etc. The process to retrieving long term memory through stimulus is called decoding. There can be multiple stimuli that brand use for recall.
Consumer experiences are also example of stimuli.
Evoked set is also effected by Recency Effect.
Schema defines structure of memory.
mindmap
    Calvin Klein
        Luxury
            Gucci
            LV
            Rolex
        Comfort
            Mother
            Bed
            Uniglow
            Sleep
        Positivity
            Dove
            Nike
            Temple
        Minimalistic
            Minimalist
            Emma Watson
            House
            Biege
        European
            Roger Federere
            Paris
            Dior
        Stylish
            Gigi
            Sabhya Sachi
            SRK
Whenever a need arises, consumers think of attributes, not solutions. Then consumers look for solutions attached to the attributes.
mindmap
    Traditional
        Temple
        Silk Saree
        Patanjali
        Mangalsutra
        Dhoti
Patanjali has strongly attached itself with the traditional node, hence it is the POP of the brand. Whereas it keeps itself away from the modern node, hence it is POD of the brand.
This can be used to identify POP and POD.
It can also be used create Brand Extension. Example, a brand called BIC create pen, razors, staplers. It tried to market perfume, but failed because the brand was attached to disposable/convenience node, but perfume cannot be attached to disposable node hence it failed.
Example Kamasutra brand creates condoms and is attached to sexy/attractiveness/indulgence node. Hence it can extend to perfume, lipstick etc.
Personality is “who you are?” or the self. There can be three personality types:
Since people like to form connections with people with similar personality, therefore brands try to portrait certain personality to attract specific type of customers. If brand doesn’t has a personality, it cannot have a high involvement purchase.
Apple has always been consistent with catering to detached personality (geeky guys). Nike also has stood consistent with message anybody can run, which appeals to detached personality.
Nike - Just Do It (1988) - Very first commercial
Brands can change personality over time.
To explain behaviors different from personality, concepts of Multiphrenic Self and Personality traits are used.
Personalities can change when a life-transforming event happens life death of loved one, birth of child, marriage.
Compliant Multiphrenic Personality
    Actual Self

How the person is when he/she is alone without any external influence.
    Ideal Self

Who the person wants to be.
    Social Self

What others think about the person.
    Ideal Social Self

What person wants others to think he/she is.
Malboro displayed cigarettes as used by macho cowboys, so the young males who wanted to display themselves as macho, started consuming it.
Now a days, heros are displayed as having six-pack abs, hence the young generation is getting to gym.
Raymonds also used “The Complete Man” tagline to make customers get interested in their products.
A good book on personality is “Presentation of Self in everyday life”, by Goffmann.
Personality traits are mostly inborn. There are in total 70+ personality traits, we’ll discuss 10 of them:
These personality traits are not orthogonal, i.e. they are not opposite of each other.
Consumer Behavior by Solomon and Consumer Behavior by Schiffmann & Kanuk are good books to understand personality traits.
Book by Robert Kalgini has a different thought process on consumer behavior.
When consumer uses the product in different ways.
When consumers seek new products or features.
When consumers have certain believes. Example boiling water. Dogmatism can be tackled only when there is an ambassador or person of authority. For example when people of FATA had believes that the polio drops would make children impotent, WHO appealed to Imams to convince disciples to get polio drops.
Cognos means knowledge. Consumers who wants to know a lot of things about are the consumers with high need for cognition.
Ethno means group, centrism means towards.
Ethnocentrism is different from Country of Origin Effect. Eg. if a car is made in Germany, and I believe that automobile technology in German is superior, then purchasing a German car is an example of Country of Origin Effect. But if I am German, therefore I’ll purchase only German car, this is Ethnocentrism.
Country of Origin Effect must have a place which has a history of superior products. This is also called Provenance Effect.
Provenance is also called 8th P. If one wants to have a luxury brand, provenance is also essential.
Study of watches is called Horology.
Switzerland is popular for it’s watches because during French Revolution, Breguet and other watch makers took shelter in Switzerland.
Switzerland is considered as a neutral country because it never participated in any world war.
If there is no Provenance Effect, the brand cannot be called as luxury brand, it can be considered premium brand but not luxury brand.
Another example if I believe that Silk Sarees from Kanchipuram are good, then I purchase Kanchipuram saree, this is Country of Origin Effect, whereas if I purchase Kanchipuram saree because I am from Kanchipuram, this is an example of Ethnocentrism.
If consumer buys products from people of his/her community, this is an example of Ethnocentrism.
Ability to comprehend things through words. If customers are high on verbalization, one should advertise through newspapers articles, magazines articles etc.
Ability to comprehend things through pictures. If customers are high on visualization, the advertisement must be done through images in billboards, newspapers etc.
Desire to look good in the eyes of others.
Consuming something to please oneself.
Each person has an internal frequency, i.e. how active lifestyle he/she likes. There is also environmental frequency, i.e. environment demands certain activity level. Eg. if a person from Shimla, where lifestyle has very low OSL (Optimum Simulation Level) is brought to Mumbai, where lifestyle has high OSL, then the person would feel irritated and will seek for environment with low OSL.
This is generally used by tourism industry.
Perception = Understand + Evaluate
Perception = Stimulus Organization + Stimulus Interpretation
graph TD
    Perception --> ORG(Stimulus Organization)
    Perception --> INT(Stimulus Interpretation)
If stimulus is there and the observer ignores the stimulus and no reaction is shown, this is called perceptual barrier.
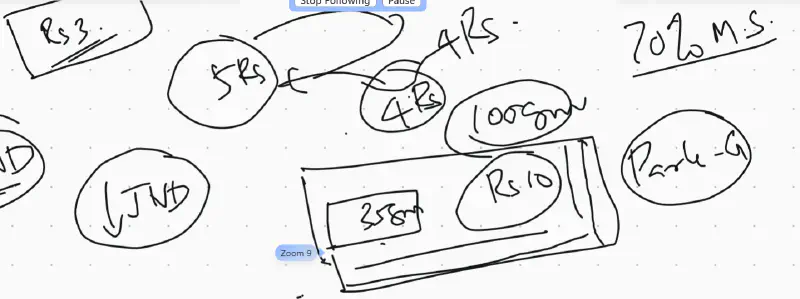
Depending on the context, there is a differential threshold which which if crossed grabs the customer’s attention, else customer ignores it. Just Noticeable Difference is the amount of change required to grab attention.
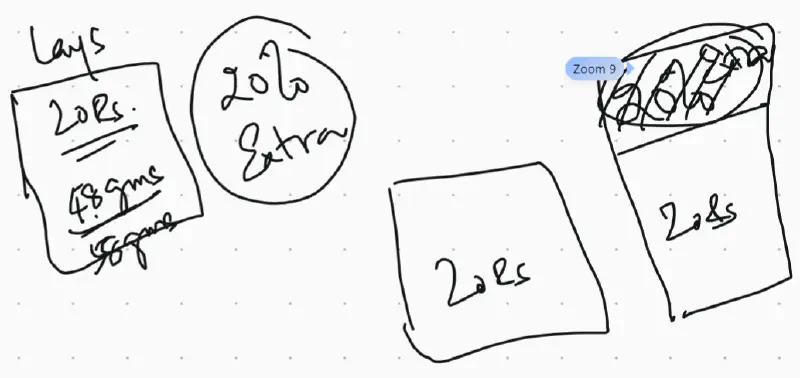
If marketer wants to show something, they keep it above JND, if marketer wants to hide something, they make it below JND. Eg. when lays wants increase the amount of lays added, since they difference in weight is unnoticeable, they increase the size of packet and put large observable label of “20% Extra”.
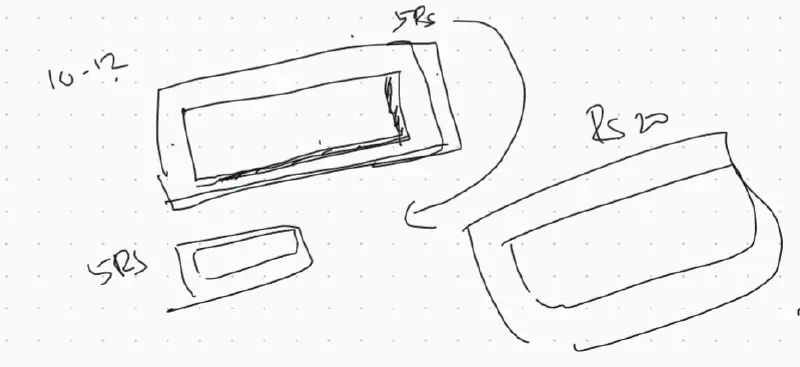
5-star reduced the quantity of chocolate gradually, keeping the changes lower than JND. First they kept packet size same just shaved off chocolate. Then they reduced packet size to meet the chocolate size. Over time, the size of chocolate has reduced a lot and introduced another variety of chocolate priced at Rs. 10.
Earlier Jim-Jam had 3 biscuits. The company reduced the size of biscuits gradually. After some time, instead of having three small biscuits, they packaged 2 big biscuits for same price.
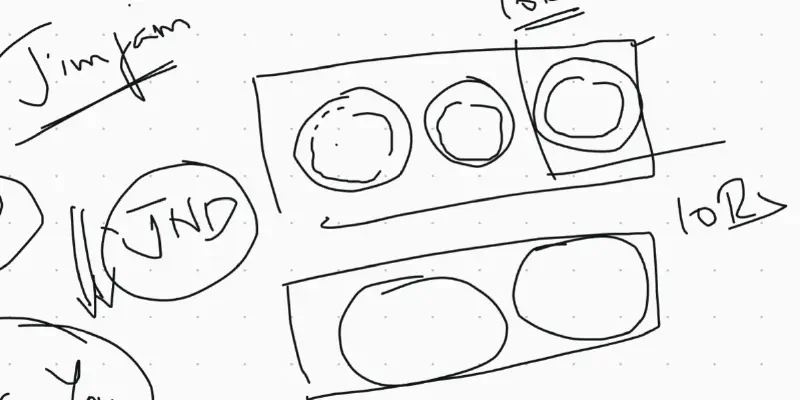
Parle-G had 100gm biscuit of Rs. 4. Then it decided to increase the price to 5. In 2 months, it lost 70% of Market share because the change was above JND. So they reverted back the price and reduced the quantity of biscuit gradually to 35gm today.
JND can be done for all senses. Eg. mutual funds are subjected to market risks are said fast to keep it below JND.
JND can be used in three ways:

In music also, if piano is played loudly than other instruments, it stands out.
In food if one flavour has strong smell or taste, this is also an example of figure and ground.
Guerilla Advertisements are examples of figure and ground.
2. Grouping: Trying to create a whole using parts.
Total Utility = Acquisition Utility + Transaction Utility
Every customer has an internal reference price, and there is an external reference price.
Example, on a special day, suite-case with MRP 15000 is being sold for 6000, customers think that the total utility they got is the worth of the suite-case (15000) plus the savings they did (9000). Total perceived utility = 15000 + 9000 = 24000
Transaction utility can be in the other forms also, by serving with smile.
Baskin Robins is a good strategy, they give 50% discounts on 31st every month.
Overdoing the price reduction strategy is harmful for brand. If price is reduced everyday, consumers will feel cheated and ignore the price. Like Boat always shows discounts, so people start ignoring the price.
Consumers use 4 techniques to organize attention:
Selective Attention and Selective Exposure thins the perception barrier. Perceptual blocking and Perceptual defense are used to harden the perception barrier.
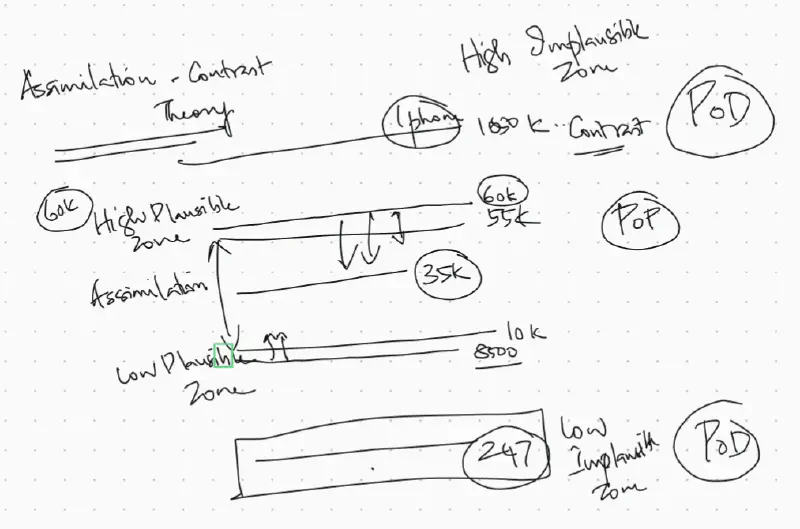
Customer has an expected price range. If the product he/she finds is in the expected range, it gets into its assimilation zone. If the product is slightly expensive, it is said to be in High Plausible Zone. If the product is slightly lower than the range, it is said to be in Lower Plausible Zone. If the product is too expensive than the expected range, it is considered to be some different product and said to be in High Implausible Zone. If the product is of much cheaper price than the expected price, it is assumed to be some other product and said to be in Lower Implausible Zone.
Being in the Assimilation Zone, Lower Plausible Zone or Higher Plausible Zone creates a POP for the product. Being in High Implausible Zone or Low Implausible Zone creates a POD for the product.
    Attitude

Learned opinion or formed disposition.
There should first be positive attitude towards consumption. After having positive opinion towards consumption, there should be a positive attitude towards product category. When there is positive attitude towards production category, then marketer should try to create positive attitude towards brand.
graph TD
    CONSUMPTION(Attitude towards Consumption) --> CATEGORY(Attitude towards Category)
    CATEGORY --> BRAND(Attitude towards Brand)
    Market Creation Process

Creating awareness towards consumption.
Attitude can change with experience and context (situation).
Involvement is highest for the Value-Expressive Function and least for the Utilitarian Function.
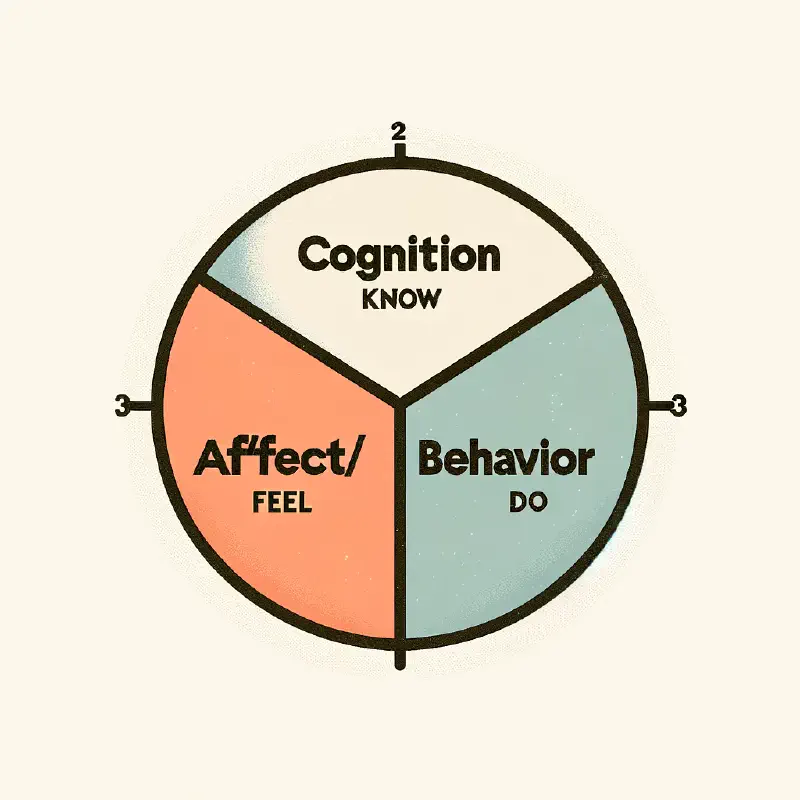
graph LR
   Know --> Feel --> Do
graph LR
Know --> Do --> Feelgraph LR
Feel --> Do --> KnowAlso called Multi-Attribute Model and Fishbein Model. It describes how opinion is formed and what the can company do to improve attitude towards product/brand.
Attitudinal Score = ∑(Belief x Importance)
| Attitudes (Importance) | IIM-Ahmadabad | Howard Business School | Masters Union |
|---|---|---|---|
| Knowledge (10) | 8 | 9 | 5 |
| Network (20) | 6 | 7 | 8 |
| Placement (50) | 9 | 8 | 7 |
| Brand Value (20) | 9 | 9 | 8 |
IIMA = (8 x 10) + (6 x 20) + (9 x 50) + (9 x 20) = 830
HBS = (9 x 10) + (7 x 20) + (8 x 50) + (9 x 20) = 810
IIMA = (5 x 10) + (8 x 20) + (7 x 50) + (8 x 20) = 720
We’ll learn details about these when studying Conjoint Analysis.
Culture = Opinion Leadership + Reference Group
    Attitude-Culture Conflict

Also called Personality-Culture conflict. When consumer wants to purchase the product but culture is against it.

Attribution Theory
Never imagine a target customer without market research.
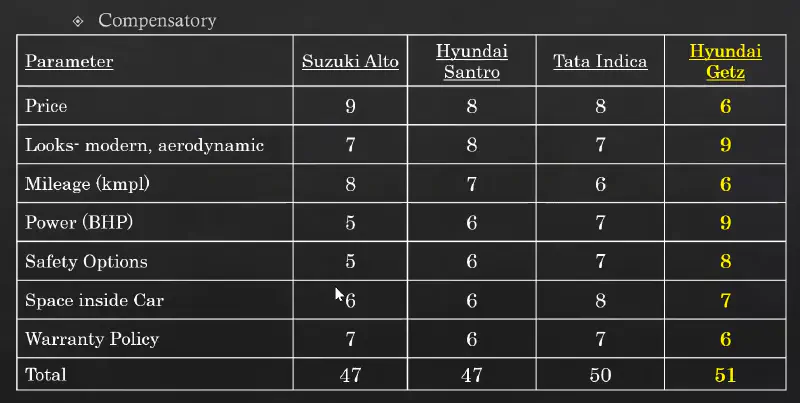
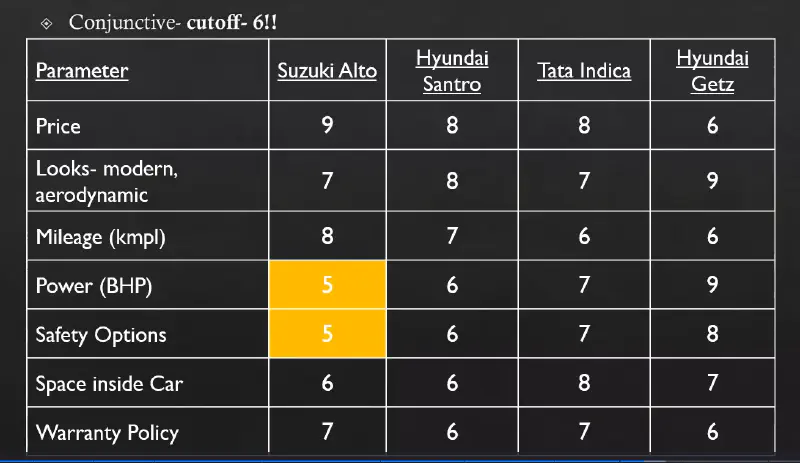
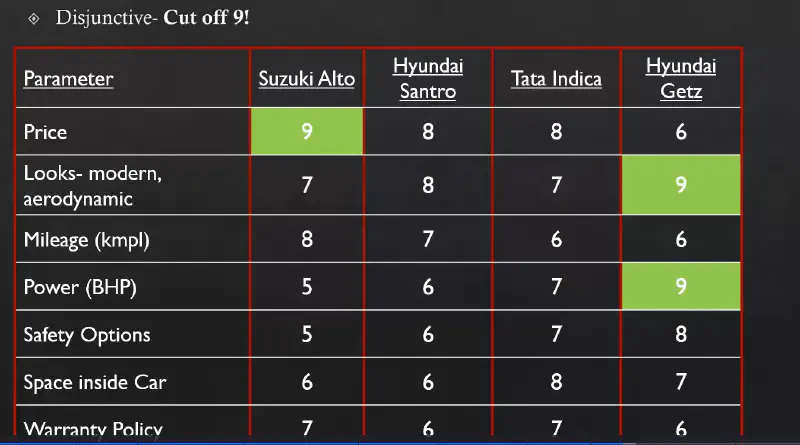
Consumers make decisions based on one or more of the following rules:
Compensatory Rule: When decision is made on the basis of all the features present. The lower value of one feature can be compensated by the higher value.
Conjunctive Rule: Lower cut-off for any feature is set for disregarding options from choice set.
Disjunctive Rule: Higher cut-off for a feature is set for creating choice set.
Here is the link to original Youtube Playlist
Pair programming is great way for knowledge sharing.
flowchart TD
    Red -- just enough code to pass --> Green
    Green --rename and extract functions and variables --> Refactor
    Refactor -- write a failing test--> Red

    style Red fill:#FAA0A0
    style Green fill:lightgreen
style Refactor fill:lightblueLisp is a language that never dies.